
Data-driven analysis of furniture conversion benchmarks, shopping behavior, and why most online furniture purchases never make it past the wishlist
After moving in with your partner, furnishing the apartment became a nightly ritual of “just looking.” One tab for Article. One for CB2. One for Pottery Barn. One open Reddit thread debating whether bouclé already feels dated. You save a cream performance-fabric sectional. Then another. Then another that’s somehow “warmer” or “less corporate” or “more collected.” Weeks later, nothing’s been purchased.
The data says this behavior is normal. Furniture e-commerce has some of the lowest conversion rates in online retail, with most brands converting somewhere between 1.2% and 1.6% of shoppers. Cart abandonment rates regularly climb above 80%. Compared to fashion, beauty, or electronics, furniture purchases move slower because they combine three difficult things at once: high prices, visual uncertainty, and emotional identity.
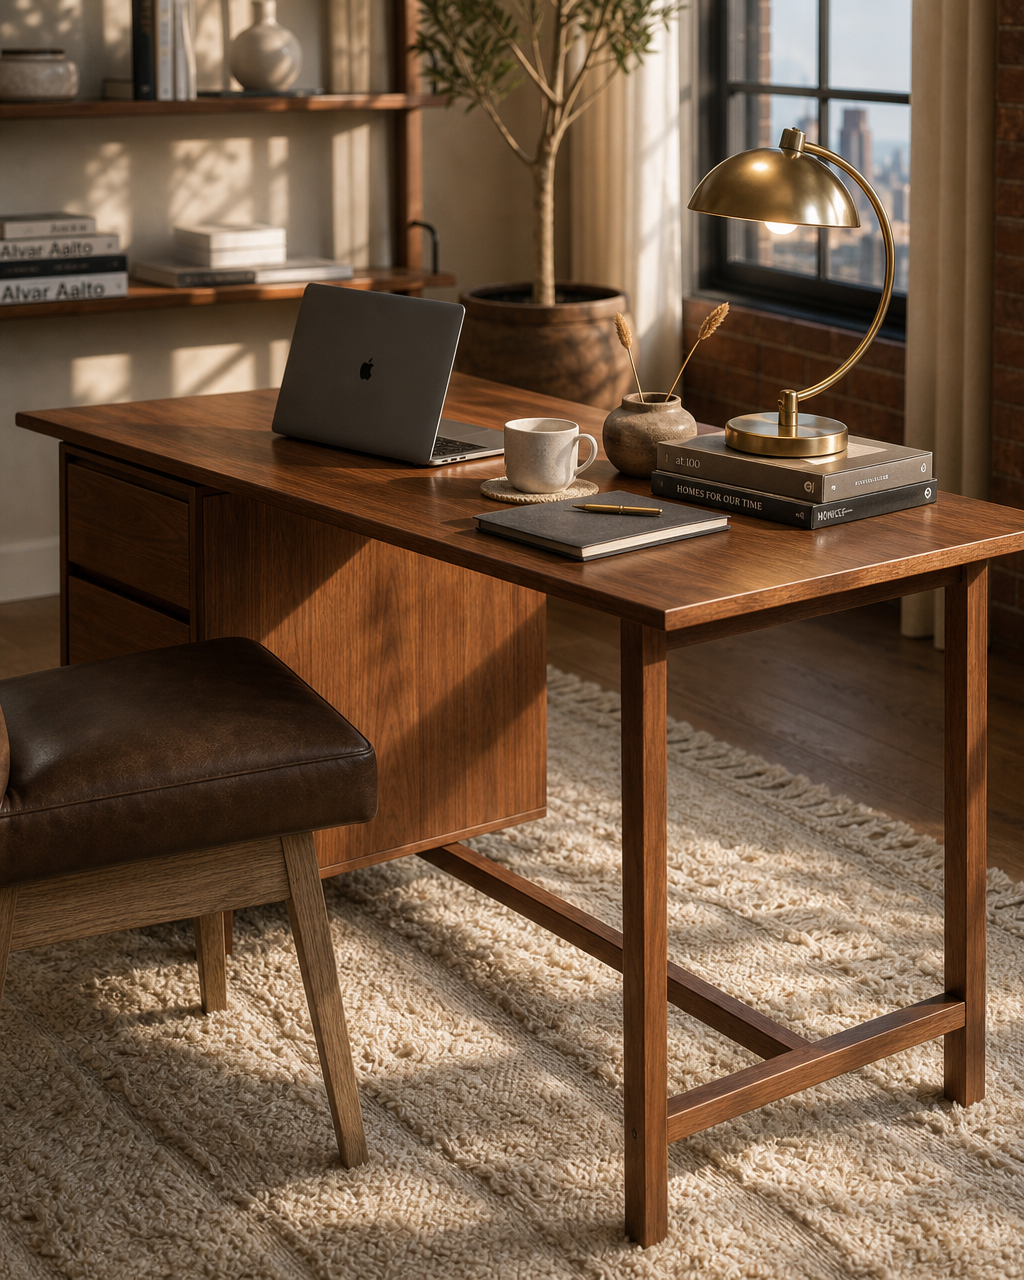
That gap between inspiration and execution is exactly where First Chair fits. Instead of pushing shoppers deeper into endless browsing, First Chair turns saved inspiration into cohesive, shoppable concepts built with real pieces from brands like CB2, West Elm, Crate & Barrel, Pottery Barn, and Lulu & Georgia. The goal is helping people confidently move from “I like this vibe” to a room that actually feels pulled together.
Key Takeaways
- Furniture has among the lowest e-commerce conversion rates at 1.2% to 1.6%, compared to 6.11% for food and beverage
- The market opportunity is massive with the U.S. furniture e-commerce market reaching $125 billion in 2024
- Shoppers are ready to buy with 62.3% of furniture searches being transactional in nature
- Cart abandonment runs rampant at 70.19% globally, with mobile reaching 79%
- Personalization dramatically improves outcomes with companies seeing 40% faster revenue growth when they get it right
- Visualization builds confidence with 80% of shoppers feeling more confident when they can see how pieces work together
- Top performers prove higher conversion is possible through personalization and improved product discovery
Average E-commerce Conversion Rate for Furniture
1. Furniture e-commerce conversion rates average just 1.2% to 1.6%
The furniture industry sits near the bottom of e-commerce conversion benchmarks. Dynamic Yield data shows furniture converting at roughly half the rate of most retail categories. This means for every 100 people browsing that performance velvet sofa, maybe one or two actually buy it. The rest leave with nothing but a saved link they'll probably forget about. This is exactly the problem First Chair solves by making it easy to go from browsing to buying complete, cohesive rooms.
2. Home and furniture conversion sits at 1.42% on average
Looking at 12-month rolling averages, home and furniture hovers around 1.42%. This number has remained stubbornly low despite massive investment in furniture e-commerce over the past decade. The problem isn't traffic. It's converting browsers into buyers, and First Chair bridges that gap by showing shoppers exactly how pieces work together.
3. Some furniture retailers see conversion rates as low as 0.5%
At the lower end of the spectrum, furniture conversion rates drop to 0.5%, compared to 2.25% for all industries combined. That's a 4x gap between furniture and the average online store. Buying a sofa online requires more confidence than buying a sweater. First Chair provides that confidence by curating complete room concepts instead of leaving shoppers to figure it out alone.
4. Food and beverage leads all categories at 6.11% conversion
For context, food and beverage e-commerce converts at 6.11%. That's nearly five times higher than furniture. The difference comes down to risk and complexity. Ordering takeout requires minimal decision-making. Furnishing a living room requires imagining how pieces work together, whether they'll fit, and if you'll still love them in three years.
5. Beauty and personal care achieves 4.55% conversion rates
The beauty sector converts at 4.55%, more than triple furniture's average. Lower price points and easier returns make buying skincare feel less risky. Furniture buyers don't have that luxury. A wrong sofa means dealing with white-glove delivery returns and weeks of waiting.
6. Luxury and jewelry has the lowest conversion at 1.19%
Only luxury and jewelry converts lower than furniture at 1.19%. Both categories share similar challenges: high price points, significant commitment, and purchases that feel permanent. The psychology of big-ticket buying creates hesitation that standard e-commerce experiences struggle to overcome. First Chair addresses this psychology by removing uncertainty through curated room concepts.
Key E-commerce Conversion Rate Statistics and What They Mean for Furniture Retailers

7. The global furniture e-commerce market reached $68.4 billion in 2025
Despite low conversion rates, the furniture e-commerce market hit $68.4 billion globally in 2025. The sheer volume of traffic compensates for poor conversion. But this also means enormous untapped potential. Even small conversion improvements translate to billions in additional revenue industry-wide. This is the opportunity First Chair captures by helping more browsers become buyers.
8. U.S. furniture e-commerce hit $125 billion in 2024
The American market alone accounts for $125 billion in sales. This makes furniture one of the largest e-commerce verticals despite its conversion struggles. Americans are clearly interested in buying furniture online. They just need help getting across the finish line, and that's exactly what First Chair provides.
9. The market is growing at 10.6% CAGR through 2034
Furniture e-commerce is projected to grow at a 10.6% compound rate through 2034, reaching $168.9 billion globally. This sustained growth creates urgency for solving the conversion problem. Retailers who figure out how to convert browsers into buyers will capture disproportionate market share.
10. 31% of U.S. shoppers buy household furniture online monthly
Nearly one-third of American shoppers purchase furniture online on a monthly basis. This frequency suggests furniture shopping has become normalized online. The issue isn't getting people to consider buying furniture digitally. It's helping them complete the purchase with confidence. First Chair turns that monthly browsing into actual purchases by providing complete room solutions.
11. 62.3% of furniture searches are transactional
Here's the real story: 62.3% of searches are transactional, meaning the person is ready to buy. They're not just browsing for inspiration. They have purchase intent. The gap between intent and action represents the core problem that First Chair addresses by turning that intent into a cohesive, buyable room concept.
12. Global cart abandonment averages 70.19%
Across all e-commerce, 70.19% of carts are abandoned before checkout. For furniture, with its higher price points and greater commitment, abandonment runs even higher. Seven out of ten people who add furniture to their cart walk away without buying. First Chair reduces this abandonment by helping shoppers visualize complete rooms before they even add items to cart.
13. Mobile cart abandonment reaches 79%
On smartphones, cart abandonment spikes to approximately 79%, compared to 68% on desktop. The smaller screen makes it harder to evaluate furniture properly. Comparing pieces, checking dimensions, and visualizing how things work together becomes frustrating on mobile.
14. Extra costs drive 48% of cart abandonment
The top reason for abandonment is unexpected extra costs at 48%. Shipping, taxes, and delivery fees that appear late in checkout create sticker shock. Furniture shipping costs can easily add hundreds to an order, and surprise fees kill conversions instantly. First Chair's insider pricing helps reduce this sticker shock by offering better prices upfront.
15. Required account creation causes 26% of abandonments
Forcing customers to create accounts causes 26% of shoppers to abandon. This friction point is especially damaging for furniture where the purchase cycle is already long. Adding unnecessary steps to an already complex decision makes people give up.
Strategies to Achieve a Good Conversion Rate in Online Furniture Sales
16. User-generated content increases conversions by 8.5%
UGC boosts conversion by 8.5%. Seeing real furniture in real homes builds trust that professional photography can't match. Customers want to see how that Lulu & Georgia rug actually looks in a Brooklyn one-bedroom, not a staged showroom.
17. Products with 11-30 reviews show 68% higher conversion
Review volume matters significantly. Products with reviews convert 68% higher than those without. For furniture, reviews address critical concerns about quality, comfort, and durability that photos can't convey. First Chair curates reviewed pieces to give shoppers that confidence from the start.
18. 99.9% of consumers read reviews before purchasing
Virtually all consumers read reviews when shopping online. For furniture purchases, reviews provide social proof that reduces risk. Shoppers want to know if that Article sofa holds up after two years, if the color matches the photos, and if delivery went smoothly.
19. 95% of customers seek out reviews when deciding
95% actively seek reviews during their purchase decision process. This behavior is especially pronounced for furniture where the stakes feel higher. A $2,000 sectional purchase demands more due diligence than a $50 throw pillow.
20. 80% of shoppers feel more confident with visualization tools
80% of shoppers report greater purchase confidence when they can visualize how pieces work together. This is where traditional furniture e-commerce fails. Browsing individual product pages doesn't help shoppers understand how a coffee table, sofa, and rug actually look as a room. First Chair delivers this visualization through complete room concepts.
21. 71% of consumers want personalized brand interactions
71% expect personalization in their shopping experiences. Generic product feeds don't satisfy this expectation. Shoppers want recommendations that understand their specific aesthetic, whether that's Scandinavian with walnut warmth or mid-century with brass accents. First Chair personalizes every experience based on your unique style.
22. Companies excelling at personalization grow revenue 40% faster
McKinsey research shows personalization leaders grow 40% faster than average performers. For furniture retail, personalization means more than showing recently viewed pieces. It means understanding taste, style preferences, and room constraints to recommend pieces that actually work together. First Chair masters this personalization by interpreting your style and creating custom room concepts.
Why First Chair Addresses the Core Conversion Problem
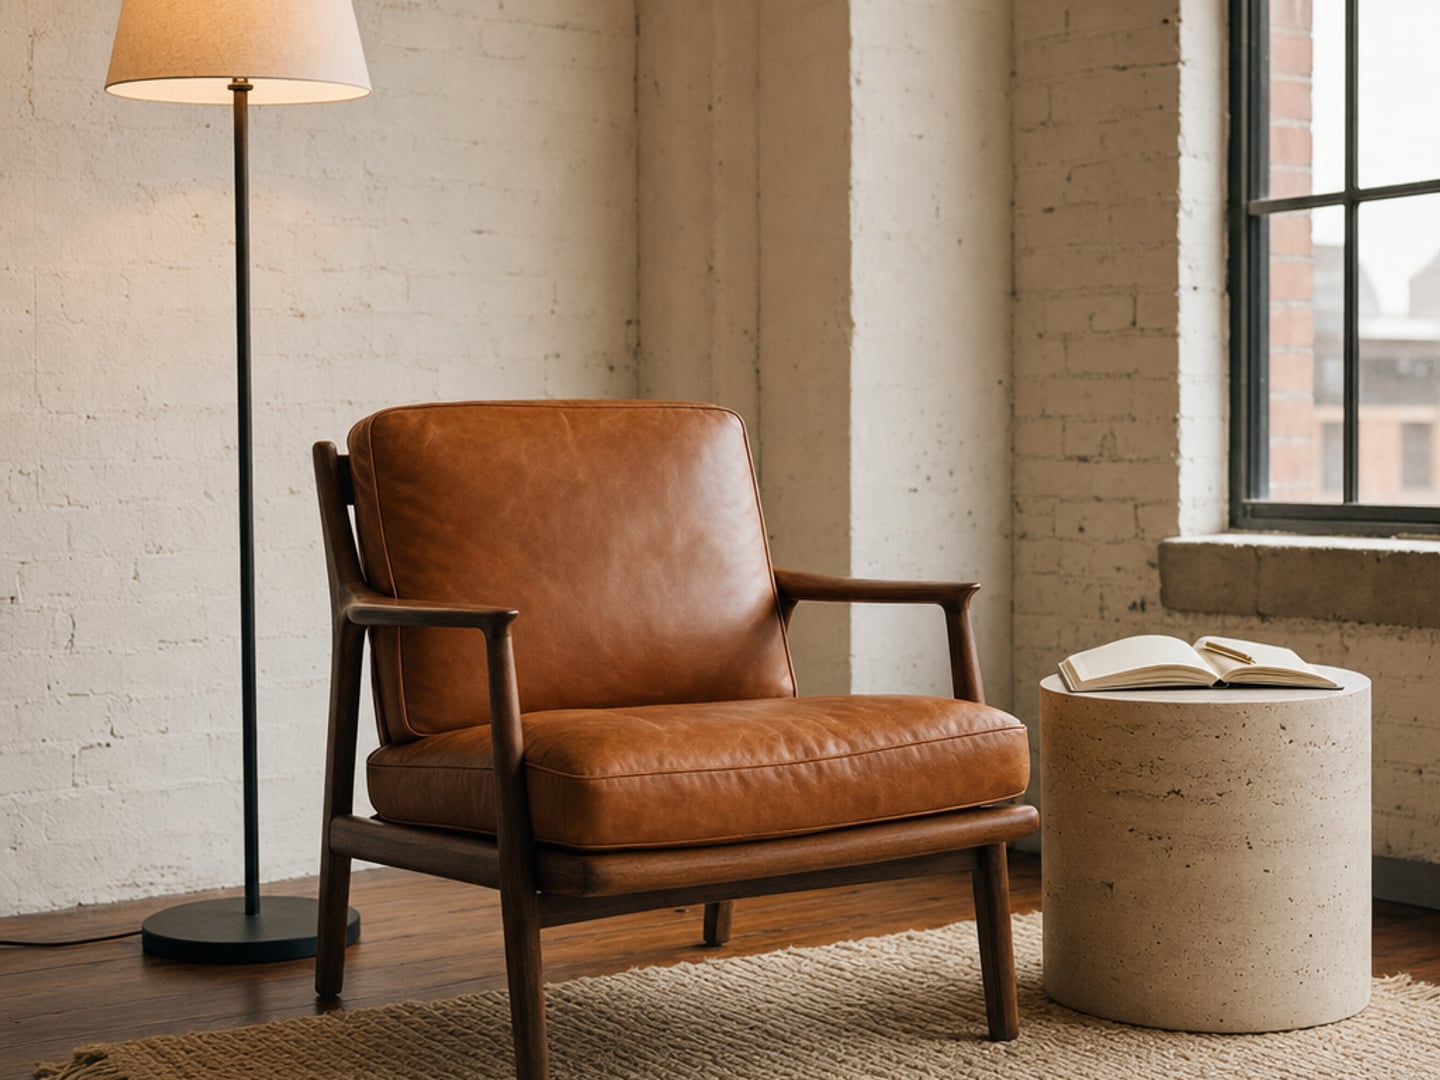
The statistics tell a clear story: furniture shoppers are ready to buy, but traditional e-commerce experiences fail to give them the confidence to commit. First Chair approaches this differently. Instead of overwhelming shoppers with endless product grids, it interprets style preferences and generates cohesive room concepts using real, purchasable pieces from retailers like West Elm, CB2, Crate & Barrel, and Pottery Barn.
Every piece First Chair recommends exists and can be purchased. No fantasy renders. No fake furniture. Just curated concepts that turn inspiration into a room you can actually buy and live in.
The Technology Factor: How Visualization and AI Impact Conversion
23. 52% of furniture businesses plan to adopt augmented reality
Over half of furniture businesses are planning AR adoption. The technology helps shoppers see how pieces fit their actual spaces. But AR alone doesn't solve the core problem of understanding how multiple pieces work together as a cohesive room. First Chair goes beyond AR by showing how complete rooms come together.
24. 59% are expanding 3D product visualization
59% of furniture businesses are expanding their use of 3D visualization. Better product images help, but the real challenge is helping shoppers visualize complete rooms, not just individual pieces spinning on a white background.
25. Shoppers engage 50% more with 3D images than static photos
3D images drive 50% more engagement than traditional photography. Enhanced visualization clearly helps. But engagement isn't the same as conversion. The gap between looking and buying remains. First Chair closes that gap by showing complete, buyable rooms.
26. 92% of Gen Z want to use AR for shopping
92% of Gen Z express interest in AR shopping experiences. This generation expects technology to reduce purchase uncertainty. Furniture retailers who meet these expectations will capture younger buyers as they furnish their first apartments. First Chair speaks to Gen Z by delivering tech-forward room design.
27. 49% of millennials say AR is "very important" for shopping
Nearly half of millennials consider AR very important for their shopping experience. This demographic, currently in prime home-furnishing years, has high expectations for how technology should help them make decisions. First Chair meets millennial expectations with intelligent room curation.
28. 78% of furniture leaders see AI customer support impacting sales
78% of industry leaders believe AI-powered customer support will significantly impact sales. The ability to answer questions instantly, provide recommendations, and guide decisions at scale represents a major opportunity. First Chair leverages AI to provide instant, personalized room concepts.
Device and Channel Performance Statistics
29. Desktop and mobile conversion have reached parity at 2.8%
Desktop and mobile rates have converged at 2.8% across e-commerce generally. For furniture specifically, mobile still lags due to the difficulty of evaluating large pieces on small screens.
30. Tablet conversion leads at 3.1%
Tablet shoppers convert at 3.1%, higher than both desktop and mobile. The larger screen makes furniture evaluation easier than phone shopping, while the casual browsing context encourages purchases. First Chair works beautifully on tablets for browsing room concepts.
31. Mobile drives 60% of e-commerce traffic
60% of all traffic comes from mobile devices. For furniture retailers, this means the majority of their visitors are browsing on screens too small to properly evaluate a deep-seat sectional or an oversized area rug. First Chair optimizes mobile to make room shopping easy on any screen.
32. Desktop generates 42% of revenue despite 35% traffic share
Desktop accounts for 42% of revenue while only representing 35% of traffic. Shoppers browse on mobile but convert on desktop. This behavior is especially pronounced for furniture where the commitment requires a bigger screen.
Traffic Source Performance for Furniture E-commerce
33. Referral traffic converts highest at 5.4%
Referral traffic converts at 5.4%, the highest of any traffic source. When someone clicks through from a trusted source, they arrive with built-in confidence. This explains why editorial features and design blogs drive valuable furniture traffic.
34. Email marketing converts at 5.3%
Email converts at 5.3%, nearly matching referral performance. Existing customers and subscribers already trust the brand. For furniture retailers, email becomes crucial for nurturing the long consideration cycle. First Chair uses email to share new room concepts with subscribers.
35. Organic search converts at 2.1%
Organic search converts at 2.1%. These shoppers have clear intent but limited brand relationship. The gap between organic and referral conversion shows how much trust matters in furniture purchasing.
36. Paid search converts at just 1.4%
Paid search converts at 1.4%, below organic performance. The transactional nature of paid search brings less-qualified traffic. Shoppers clicking ads are often earlier in their journey, still comparing rather than ready to buy.
37. Social media converts lowest at 0.7%
Social traffic converts at 0.7%, the weakest performing channel. Instagram and Pinterest drive massive furniture inspiration but struggle to convert. The gap between double-tapping a room photo and actually buying the pieces in it is significant. First Chair bridges social inspiration to actual purchase.
38. Facebook Ads convert at 3.77% for furniture
Facebook Ads achieve 3.77% for furniture specifically. The platform's targeting capabilities help reach high-intent shoppers. Visual formats work well for furniture products.
39. Google Ads convert at 2.73% for furniture
Google Ads convert at 2.73% for furniture advertisers. Search intent drives this performance, but the rate still trails Facebook. The combination of visual format and targeting gives social an edge for furniture.
Regional Market Dynamics
40. Asia Pacific leads with 38.6% market share
Asia Pacific commands 38.6% of global furniture e-commerce revenue. China alone accounts for approximately $45 billion in sales. The region's mobile-first shopping culture has pushed furniture e-commerce adoption faster than Western markets.
41. North America holds 27.3% of the global market
North America contributes 27.3% of worldwide furniture e-commerce revenues. Despite lower market share than Asia, higher average order values make North American customers particularly valuable. First Chair targets this market with premium American and European retailers.
42. The European furniture retail market is worth EUR 165 billion
Europe's market totals EUR 165 billion, representing over 25% of the worldwide market. The region's design heritage and style-conscious consumers create opportunities for taste-driven shopping experiences.
43. 26% of European consumers bought furniture online in Q4 2024
26% of European consumers purchased furniture, home accessories, or gardening products online during Q4 2024. This quarter represented the best performance since 2022 for the home and garden industry, signaling sustained recovery.
Future Trends and Projections
44. The market will reach $168.9 billion by 2034
Global furniture e-commerce is projected to reach $168.9 billion by 2034. This growth trajectory creates enormous opportunity for retailers who solve the conversion problem. The companies that help shoppers move from inspiration to purchase will capture disproportionate value. First Chair is positioned to capture this growth by solving the core conversion challenge.
What These Statistics Mean for Furniture Shoppers
The data paints a clear picture. People want to buy furniture online. They browse constantly, save inspiration religiously, and search with purchase intent. But traditional e-commerce experiences fail to provide the confidence needed to commit.
The average 1.2% to 1.6% rate isn't a technology problem. It's a confidence problem. Shoppers can't visualize how pieces work together. They can't tell if that CB2 coffee table will actually look right with their existing sofa. They worry about scale, color accuracy, and whether everything will feel cohesive.
This is exactly what First Chair addresses. Instead of leaving shoppers to figure out room composition on their own, First Chair interprets style preferences and generates complete room concepts using real pieces from West Elm, Crate & Barrel, Pottery Barn, Lulu & Georgia, and other retailers. Every recommendation can actually be purchased. Insider pricing on most pieces makes the room more accessible.
Frequently Asked Questions
What is a typical e-commerce conversion rate for the furniture industry?
Furniture e-commerce conversion rates typically range from 1.2% to 1.6%, with some retailers seeing rates as low as 0.5%. This makes furniture one of the lowest-converting e-commerce categories. Top performers achieve higher conversion through personalization and improved product discovery.
Why are furniture conversion rates so much lower than other categories?
Furniture purchases involve higher price points, longer commitment periods, and greater uncertainty about fit and style. Unlike apparel or beauty products, furniture is difficult to return and requires imagining how pieces work together in a specific space. The 70.19% cart abandonment reflects this hesitation, with unexpected costs and complexity driving shoppers away.
How does mobile shopping impact furniture e-commerce conversion?
Mobile drives 60% of traffic but converts poorly for furniture. Mobile cart abandonment reaches approximately 79%, compared to 68% on desktop. Small screens make it difficult to properly evaluate furniture scale, materials, and how pieces coordinate together.
Can visualization tools improve furniture conversion rates?
Yes. 80% of shoppers report greater confidence when they can visualize how pieces work together. However, most visualization tools focus on individual products rather than complete room composition. The real conversion opportunity lies in helping shoppers see curated concepts that show how multiple pieces work as a cohesive space.
What percentage of furniture searches indicate purchase intent?
62.3% of searches are transactional in nature, meaning shoppers are ready to buy. This high intent makes the low conversion rates even more striking. The gap between wanting to buy and actually buying represents the core opportunity for retailers who can build shopper confidence.